You can easily visualise your dynamics 365 or model-driven app data with just a few clicks
Using a new feature that Microsoft have introduced which can be turned on for any model-driven app. This gives you the ability to allow Power BI to automatically generate visuals for any table (entity) view.
The system administrator just needs to turn ‘On’ the feature called ‘Enable Power BI quick report visualization on a table’ from within the features area of the model-driven app and users of the model-driven app then need to add this visualization feature to a table or tables by clicking the button when in a view.
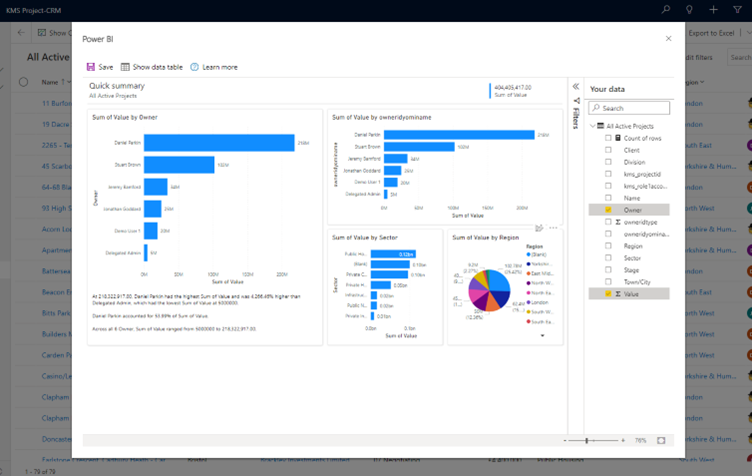
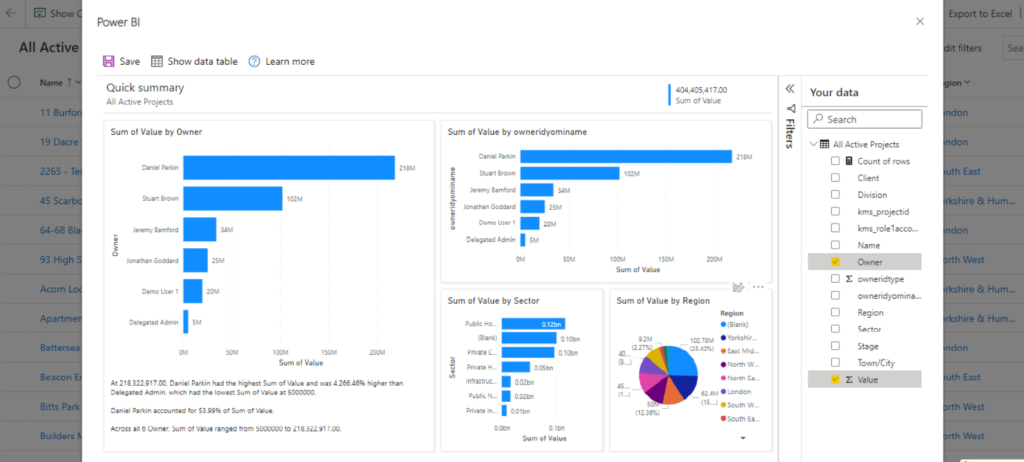
The results can be an impressive Power BI dashboard visual, as shown here!
Edit your model-driven app
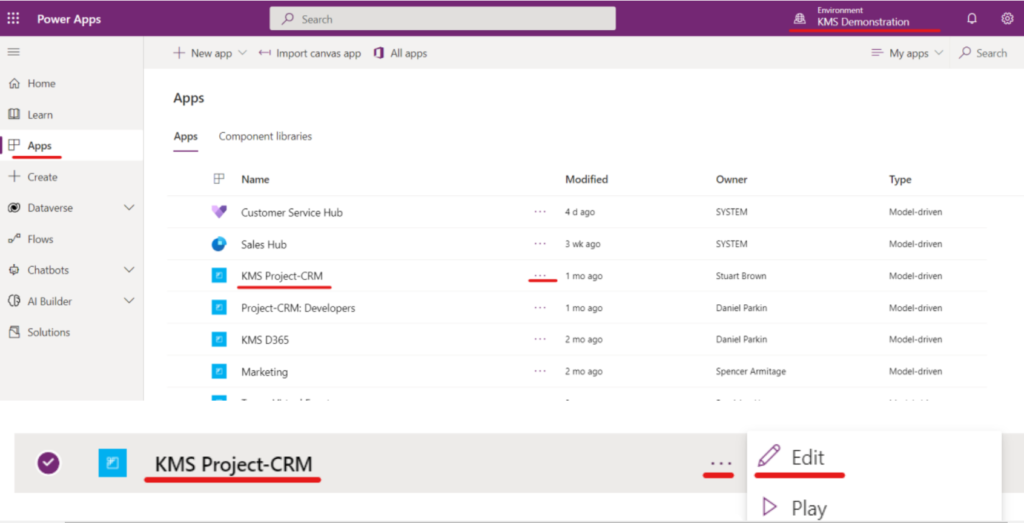
Make sure you are connected to the correct ‘Environment’, then open the model-driven app in the modern app designer (https://make.powerapps.com/). Below I click on the ellipses to the right of the ‘KMS’ app and select ‘Edit’
Access model-driven app settings
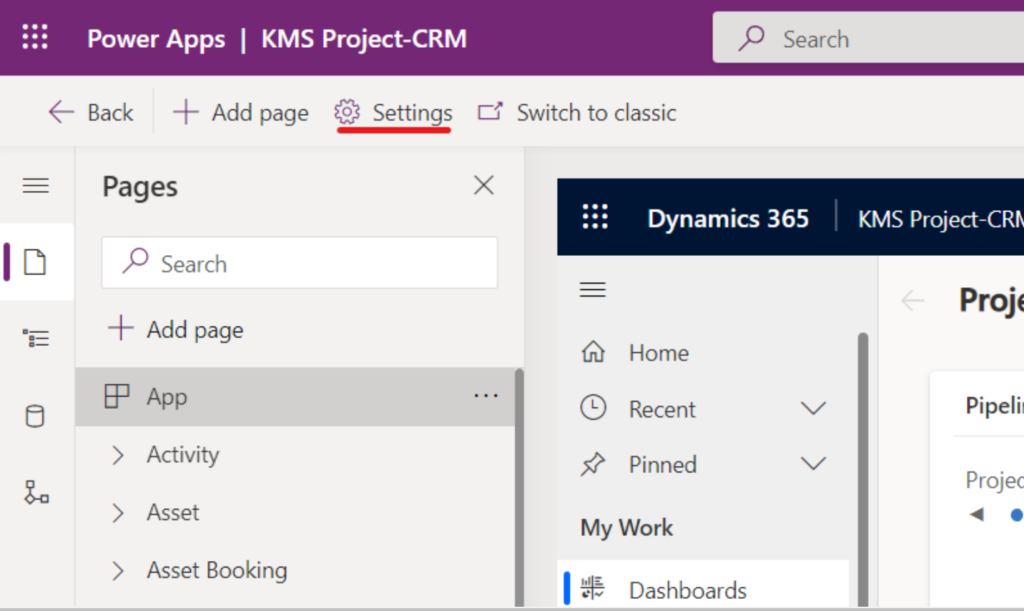
This will open your model-driven app editor, now you need to click the settings cog
Enable Power BI quick report visualization
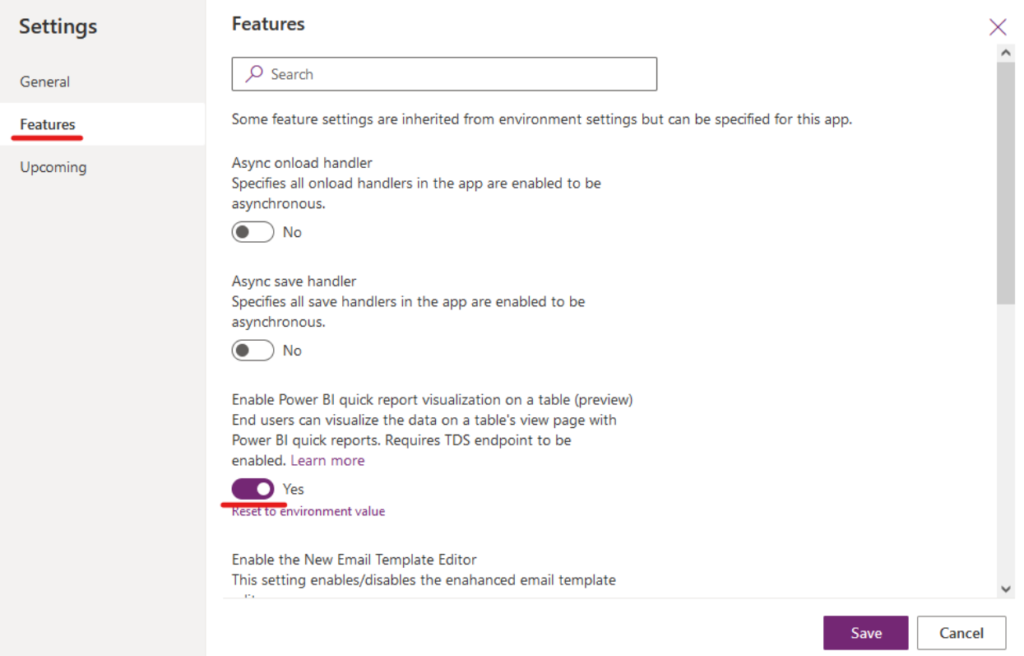
Navigate to ‘Features’ and enable the ‘Power BI quick report visualization on a table’ option and then click ‘Save’.
Publish your change
Click the ‘Publish’ button within the model-driven app editor
Power up your entities views with Power BI
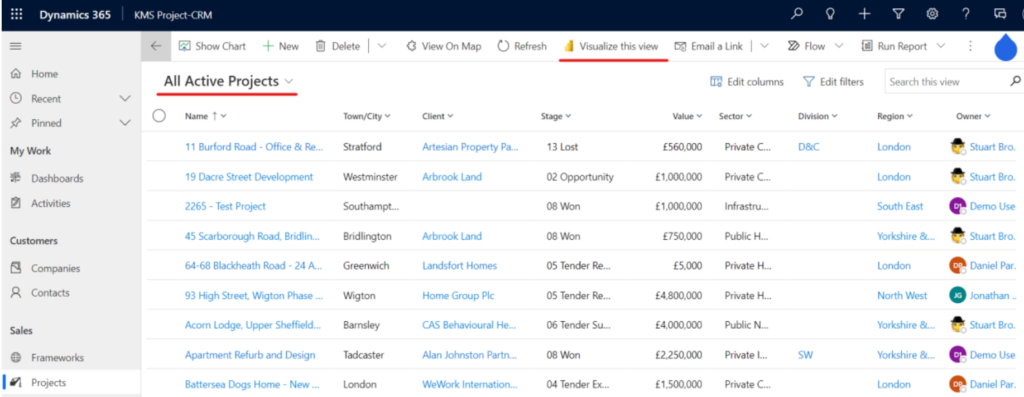
In your model-driven app, choose the table (entity) and the view you wish to add the Power BI Visualization, then click the ‘Visualize this view’. Here I have chosen the custom ‘Project’ table and the ‘All Active Projects’ view.
Power BI now generates visuals of the data in your view, so it might make sense to include dates, values and various categories, so the visuals automatically have something to report on. The first time it runs it can take a little while to go through, but then you should be presented with some nice visuals like shown here:
Make it your own
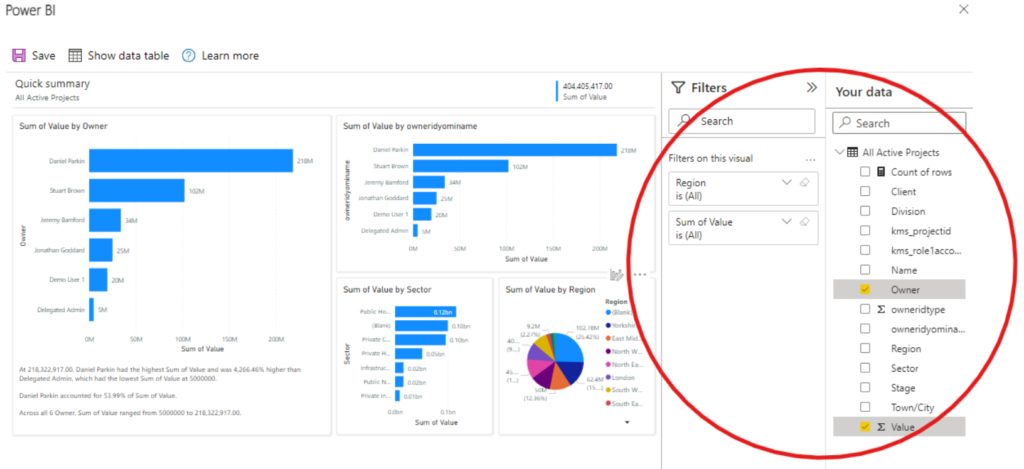
It is possible to alter columns in views, filters and the visuals you see in the report, by expanding the panels on the right-hand side in the ‘Your data’ and ‘Filters’, as well clicking on the button on the top right of the individual panels
Create Dazzling Reports
And there we have it! You now have Power BI alongside your tables and entities within your Dynamics 365 or Model-driven app.
You can let your creativity fly and help everyone in your organisation to easily understand the data relevant to them.